In my last semester at the I School I took an introductory course in data analysis using Python. I was pretty unfamiliar with statistics prior to the course and am still very much an amateur data scientist, but the course gave me just enough skills to be brave (perhaps foolishly so) in the face of an unruly data set.
Since the end of the semester I’ve found myself going back to these tools frequently, because they enable me to actually follow up on the random questions/curiosities/whims I get from time to time using public datasets and a few lines of code.
What is r/ProgressPics?
For this post I pulled data from a subreddit called Progress Pics. Progress pics is a place where people who are working on some form of body transformation go to post before and after pictures of themselves. I’ve been trying to improve my fitness lately so I’ve been frequenting the sub on and off for about six months.
It caught my eye as a potential source of interesting analysis because, unlike most subreddits, the community at progress pics has a title post format that encourages the use of structured data. Posters who are providing pictures are instructed to include their gender, age, height, start weight, and end weight in the post title, in a format that looks something like: F/23/5’5″ [189lbs > 169lbs = 20lbs].
The more structure you add to a blob of text, the easier it is to understand programmatically, so this data seemed like a good opportunity for analysis.
Method
This analysis was done in IPython notebook, using data analysis packages Pandas, numpy, and matplotlib. I used the Reddit API to pull in as many posts from the subreddit as I could before the API complained, and ended up with a dataset of about 1600 posts. The Reddit API provided post metadata including title, number of comments, number of votes, date/time, and more. Then, after some initial data cleanup, I used a series of regular expressions to extract the poster’s gender, age, height, start weight, and end weight from the post title.
After being filtered through these regexes, about half (863) of the posts had good data for all of these metrics, so I dropped the remaining ones as this is a sufficiently large sample.
About the Data Set
So, who are the posters of r/ProgressPics? Some quick facts:
- Gender: 362 female (42%), 501 male (58%)
- Age: Average age 24, range 15-54
- Height: Average height 5’6″ , range 4’11″ – 6’8″
- Pounds change (lost or gained): Average 47 pounds, range 0-215
Descriptive Statistics
Here are some random findings from the data provided by Reddit and scraped from the title:
- Almost no one has Reddit Gold

- About 7% of posts are NSFW. I don’t have a chart of it, but more women than men post NSFW posts.

- The vast majority of pictures are posted on Imgur:

- The age demographic is pretty representative of Reddit as a whole:

- Here we see the height of posters broken out by gender. The huge jump is at 72″ or 6′, which probably indicates some fibbing on the part of the 5’11″ males

- This chart shows a histogram of start and end weight which really helps visualize the weight lost!

- For this analysis I was very interested in the influence of gender on voting and commenting behavior. It seemed that female posters get way more votes and comments than male, which is clearly true from the data:

- A scatterplot demonstrates the relationship between gender, scores, and pounds lost/gained. While male posters hover around the lower range of scores regardless of pounds lost, and some women fare about the same, a select few women climb out of the fray with 1500+ points.This chart also shows how almost no women report weight gain.

Significant Relationships
What conclusions can we draw out of correlation analysis of this data? With a sample size of 800 the correlation coefficient doesn’t have to be extremely large to be significant.
Assorted findings from looking at correlations:
- Unsurprisingly, there is a strong positive correlation between pounds change and score – in general, people who lose more receive more upvotes and more comments.
- There is also a positive relationship between age and pounds change, possibly because older people have put on more weight over time and thus have more to lose.
- For men, age is positively correlated with final BMI. Older men are bigger than younger men. There is no relationship for women.
- There is a weak correlation between age and number of upvotes for men. Older men receive more votes than younger men.
Gender, Final BMI, and Score
One particular area worth exploration is the relationship between gender, final BMI, number of comments, and score.
This was ultimately the question that piqued my interest in this analysis. Anecdotally speaking, it seemed that a certain subset of posters were receiving an inordinate number of votes and comments when compared with the number of pounds lost. In other words, it seemed like people were voting based on the current size of the person posting rather than the size of the accomplishment. Furthermore, this effect seemed to be particularly strong when the poster was female.
The data supports these conclusions:
- While there is a weak inverse correlation between final BMI and score for all posters, this relationship is strong for female posters. In other words, as a female poster’s BMI goes down, the score the post receives goes up.
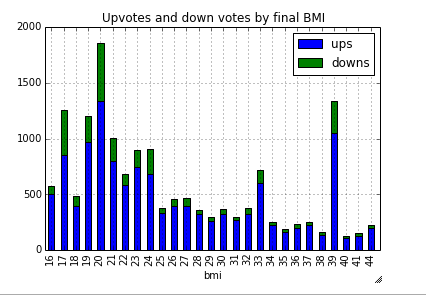
- When looking at voting behavior by final BMI, there is an interesting pattern — downvotes are highest at the lower end of the bell curve. It turns out that the number of downvotes are also inversely correlated with BMI.

- When we group into standard BMI categories, the effect of gender and body size on score are even more striking. For men, posters who are considered normal or overweight receive approximately the same average score. It’s also “better” on r/progresspics for man to be considered obese than underweight. For women the situation couldn’t be more reversed.

- A final point of interest is the number of comments a post receives. While the number of comments is related to the score, people also tend to comment on things that they don’t like (“controversial” posts in Reddit land). As the following chart shows, underweight women result in a flurry of comments.

Data
If you’d like to perform your own analysis of this data, click here to download it as a CSV.